CSV Data Set Config:
For adding CSV file for customizing the user input, CSV Data Set Config is used
FTP Request Defaults:
This is used for FTP server
HTTP Authorization Manager
The Authorization Manager lets you specify one or more user logins for web pages that are restricted using server authentication. You see this type of authentication when you use your browser to access a restricted page, and your browser displays a login dialog box. JMeter transmits the login information when it encounters this type of page .
HTTP Cache Manager
The HTTP Cache Manager is used to add caching functionality to HTTP requests within its scope.
HTTP Cookie Manager
The Cookie Manager element has two functions:
First, it stores and sends cookies just like a web browser. If you have an HTTP Request and the response contains a cookie, the Cookie Manager automatically stores that cookie and will use it for all future requests to that particular web site. Each JMeter thread has its own “cookie storage area”. So, if you are testing a web site that uses a cookie for storing session information, each JMeter thread will have its own session. Note that such cookies do not appear on the Cookie Manager display, but they can be seen using the View Results Tree Listener.
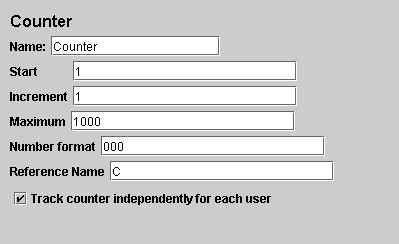
Counter
Allows the user to create a counter that can be referenced anywhere in the Thread Group. The counter Config lets the user configure a starting point, a maximum, and the increment. The counter will loop from the start to the max, and then start over with the start, continuing on like that until the test is ended.

Listeners:
Listeners are the elements used for generating graph. The following are the listeners found to be useful in terms of flexibility.
View Results Tree (Not for the Graph, But used to see the responses of the each sampler)
The View Results Tree shows a tree of all sample responses, allowing you to view the response for any sample. HTML view also available in this listener
Other listeners that are useful are,
• Transaction Throughput Over Time
• Aggregate Graph
• Graph full results
Aggregate Graph
The aggregate report creates a table row for each differently named request in your test. For each request, it totals the response information and provides request count, min, max, average, error rate, approximate throughput (request/second) and Kilobytes per second throughput. Once the test is done, the throughput is the actual through for the duration of the entire test.
Graph full results
The Graph Results listener generates a simple graph that plots all sample times. Along the bottom of the graph, the current sample (black), the current average of all samples(blue), the current standard deviation (red), and the current throughput rate (green) are displayed in milliseconds.
< !nextpage–>
Assertions:
Adding Response Assertion
The response assertion control panel lets you add pattern strings to be compared against various fields of the response. This is a way of content verification in Jmeter


4 replies on “Introduction to Jmeter”
[…] Loadtesting Apache Active MQ , JMS-Point-to-Point sampler in Jmeter will help us. Think that you do not have JNDI settings and no apache activemq for JMS messaging, […]
[…] Loadtesting Apache Active MQ , JMS-Point-to-Point sampler in Jmeter will help us. Think that you do not have JNDI settings and no apache activemq for JMS messaging, […]
[…] Jmeter is an open source tool. […]
[…] Jmeter is an open source tool. […]